http://blog.trainingpeaks.com/posts/2008/6/23/pinotti-wins-italian-national-time-trial.html nazionale si ma non credo si sia risparmiato per non umiliare gli avversari,in effetti ricordavo male non sono 360w...la cosa mi lascia un po allibito perche a mio avviso non puoi fare piu dei 50 con 350 w a meno che tu non sia finito in una pressa o la crono sia con il vento a favore o altre opzioni un po irregolari tipo una moto che ti segue da davantiPenso che con 360W possa avere vinto qualche crono nazionale, cmq mi sembra di ricordare che ai mondiali di Mendrisio abbia x 1 HR sviluppato 400W ..... che sono tanta roba x un fisico così minuto
Si sa qualcosa dell'ultima crono di Milano?
Training and Racing with a Power Meter (parte seconda)
- Creatore Discussione samuelgol
- Data di inizio
- Watchers 77
Stai usando un browser molto obsoleto. Puoi incorrere in problemi di visualizzazione di questo e altri siti oltre che in problemi di sicurezza. .
Dovresti aggiornarlo oppure usarne uno alternativo, moderno e sicuro.
Dovresti aggiornarlo oppure usarne uno alternativo, moderno e sicuro.
- Stato
- Chiusa ad ulteriori risposte.
stavo seguendo il Giro del Delfinato...e Savoldelli l'ha sparata grossa, "i corridori sono a 300W, non stanno andando forte ..quando ero professionista avevo 460Watt di soglia e Armstrong 540W".
evidentemente non gli avevano spiegato cosa significano i watt in soglia...
evidentemente non gli avevano spiegato cosa significano i watt in soglia...
in effetti... :-)stavo seguendo il Giro del Delfinato...e Savoldelli l'ha sparata grossa, "i corridori sono a 300W, non stanno andando forte ..quando ero professionista avevo 460Watt di soglia e Armstrong 540W".
evidentemente non gli avevano spiegato cosa significano i watt in soglia...
stavo seguendo il Giro del Delfinato...e Savoldelli l'ha sparata grossa, "i corridori sono a 300W, non stanno andando forte ..quando ero professionista avevo 460Watt di soglia e Armstrong 540W".
evidentemente non gli avevano spiegato cosa significano i watt in soglia...
Non c'è modo di comunicarglielo?
dipende come era stata determinata ad ogni modo credo che se non la aveva a 460 la avrà avuta a 440
stavo seguendo il Giro del Delfinato...e Savoldelli l'ha sparata grossa, "i corridori sono a 300W, non stanno andando forte ..quando ero professionista avevo 460Watt di soglia e Armstrong 540W".
evidentemente non gli avevano spiegato cosa significano i watt in soglia...
Penso abbia detto il vero,il range di potenza di un Prof parlo di soglia anaerobica si aggira tra i 400/500 watt.
Atleti del calibro di Savoldelli&Co. questi valori sono alla base di un Prof.
"I corridori sono a 300W" se parlava dell'atleta in testa a tirare il gruppo è veritiera come supposizione,di questo si tratta.
Spero Roberto mi corregga se ho detto una bischerata
secondo me è il concetto di soglia che è cambiato. Savoldelli forse correva prima che H&C predicassero il loro concetto di ftp. Si sentono spesso ancora oggi amatori che vantano soglie >350w rilevate con test conconi che in pratica equivalgono (a occhio) a una CP8'
Link:
http://giro2012.cyclingpro.it/tag/priamo/
attendo il R.Massa per chiarimenti sull'analisi del "falco"
http://giro2012.cyclingpro.it/tag/priamo/
attendo il R.Massa per chiarimenti sull'analisi del "falco"
secondo me è il concetto di soglia che è cambiato. Savoldelli forse correva prima che H&C predicassero il loro concetto di ftp. Si sentono spesso ancora oggi amatori che vantano soglie >350w rilevate con test conconi che in pratica equivalgono (a occhio) a una CP8'

nel gergo italiano "soglia" ha molteplici interpretazioni (e ciò crea molta imprecisione).
Non è raro trovare anche sul forum atleti che riportano soglie "astronomiche"
Il valore citato dal buon Savoldelli è quasi sicuramente riferito a OBLA, che non è LT, FTP e neppure MLSS (articolo)
Riferimenti più pratici:
Bjarne Riis - 6.8 W/kg for 35 min on Hautacam. Or Armstrong - 6.6 W/kg for 38 min on Alp d'Huez
Bjarne Riis is estimated to have produced 6.8W/kg (480W) on Hautacam when he won the Tour in 1996. Armstrong's estimated power output on Alp d'Huez was 6.6 W/kg (465W). This is Vayer and Portoleau's estimation, and I believe it to be accurate. I actually saw a PhD student from Texas present a similar analysis at the ACSM conference in 2005, and he had worked out 495W (7 W/kg), taking into account the gradient every 100m as well as wind speeds. If anything this is more accurate. But as I mentioned, we'll be "conservative" in our calculations, so let's take the lower option and see what it means, physiologically.
We again assume 23% efficiency (in Armstrong's case, this is not an assumption - it was measured by Coyle), and we can calculate that the oxygen cost of producing 465 W is equal to 81.96 ml/kg/min. Using method 1, the equation from the published literature, we find oxygen use of 82.00 ml/kg/min, pretty much identical.
Now, is it possible to ride at 81.96 ml/kg/min for almost 40 minutes? If you are at 90% of maximum, then it means that the VO2max must be equal to 91.07 ml/kg/min. If you are at 85% of maximum, then the maximum must be 96.42 ml/kg/min. Given that by the time these performances happen, the cyclist has been in the saddle for five hours, not to mention about 2 weeks before, I feel pretty safe in saying that you're projecting a VO2max that lies somewhere between 91 and 96 ml/kg/min, probably closer to 96 ml/kg/min.
Another example comes from Armstrong's own words. In this interview, he says "I also cranked out 495 watts for more than 30 minutes". 495 W is about 7W/kg, and applying the same equations as I've done throughout this post, you can work out that it requires oxygen consumption of 87 ml/kg/min, and a VO2max of 97 ml/kg/min (and that's at 90% of maximum. If you go with 85%, you get 103 ml/kg/min...).
Is that realistic? I suspect that your answer to that question depends not on what you know, but rather on what you want to believe. I don't believe that it is possible, because the combination of high efficiency (and 23% is high) and high VO2max doesn't seem to exist. In fact, Lucia et al showed that there was an inverse relationship, so that those with the best efficiency had the lowest VO2max. So the problem is that if you suggest that we increase the efficiency to make the predicted VO2max come down, you're chasing the pot of gold at the end of the rainbow, because the possible VO2max is coming down anyway!
However, people will draw their own conclusions. I am of the opinion, like Prof Aldo Sassi, that a value above 6.2 W/kg is indicative of doping. And in the coming weeks, I will post more on this, including graphs that hopefully illustrate this point even more clearly. But, as always, there is likely to be debate.
Purtroppo non incrocio più il Falco sulle mie strade (quasi ogni giovedì scalava la Presolana) altrimenti glielo riferivo
Ultima modifica:
Grazie Rob.Massa,il finale dell'articolo mi ha lasciato di stucco.Secondo il dott.Aldo Sassi tale valore è indicativo di doping
Es.
Per Contador risulta 436:59=7.39 watt per chilo,un rapporto stratosferico ed allucinante
Per i tempi passati invece Indurain risultava 448:80=5.6 watt per chilo
Interessante articolo.
Grazie
Es.
Per Contador risulta 436:59=7.39 watt per chilo,un rapporto stratosferico ed allucinante
Per i tempi passati invece Indurain risultava 448:80=5.6 watt per chilo
Interessante articolo.
Grazie
su 60'=FTP
lo ribadì, se non ricordo male, in una conferenza in Australia (pre mondiale di 2 anni fa)
cerco video
Penso che il valore di FTP di Contador sia inferiore, sempre considerando che sono valori calcolati indirettamente e non da misurazione strumentale diretta:
2009 Tour
2010 Tour (dati comparati con quelli registrati da Horner & altri atleti)
2011 Giro
...a pensare male...si può vedere un certo trend nella prestazione del singolo atleta in 3 anni...
mentre quello di Indurain superiore
lo ribadì, se non ricordo male, in una conferenza in Australia (pre mondiale di 2 anni fa)
cerco video
Penso che il valore di FTP di Contador sia inferiore, sempre considerando che sono valori calcolati indirettamente e non da misurazione strumentale diretta:
2009 Tour
Ferrari's been estimating VAM and he's seen the power data of many of his riders from their top performances over the years- so I would trust his data (which is very close to Mr. Vayer's data). I think Ferrari know's Lance's data better than anyone hereBut you can feel free to armchair it otherwise
http://www.53x12.com/...epth.view&id=104
Performances at the Tour 2009
By: Michele Ferrari
Published: 19 Jul 2009
On the ascent to Verbier (638m of difference in height at 7.5%) Alberto Contador (62kg) climbed at 1852 m/h, equal to 6.73 w/kg, developing an average of 417w.
Lance Armstrong (72 kg) climbed at 1720 m/h, equal to 6.25 w/kg, developing 450w.
The difference between their VAM's is 7.4% in favor of Alberto, while Lance, whose body weight is 16% heavier, pushed 8% more watts: a suggestion that in the upcoming time trial in Annecy it could be a very close and uncertain.
In Arcalis (751m of ascent at 7.1%) Contador climbed at 1671 m/h, equal to 6.18 w/kg, with Armstrong and all the other best riders at 1649 m/h (6.10 w/kg); but in the last couple of km Alberto had already showed a power that was 7.2% superior to his rivals'.
2010 Tour (dati comparati con quelli registrati da Horner & altri atleti)
6W/kg? Barely. Power output data from the Col du Tourmalet
Yesterday saw the big showdown of the Tour on its final climb. Two great climbers in Alberto Contador and Andy Schleck rode man-on-man up one of the most famed climbs of cycling, in thick mist, in a battle that many felt would decide the yellow-jersey. In the end, it won't, with a time-trial to go and two riders who were inseparable on the climbs. But it was an epic day, and produced some epic performance.
So, to continue our analysis of the power outputs in the Tour, here are some insights, gleaned from Chris Horner, Chris Anke Sorensen and some self-timing of the climb (once again, power output files courtesy SRM and Training peaks)
The Tourmalet dissected. First, some estimates...
To wet the appetite, some interesting estimates of power output emerged yesterday. First, for a really methodical, and I believe quite accurate method of ESTIMATING the power outputs, check out Cozybeehive, where Ron has analysed the climb segment by segment.
This method of estimating the power output relies on using the rate of vertical ascension, or VAM, which can be calculated if you know the distance and the gradient of the climb. And herein lies a problem - there are many discrepancies in how these climbs are 'mapped', and this affects the value you calculate. Also, wind, drafting and changes in the grade also affect the final estimated power output. There's been some pretty strong criticism of it, but so far, comparing the estimates to the actual SRM data has produced quite similar values, rarely different by more than 0.2W/kg.
On the note of distance, yesterday, the 18.6km to go banner for the start of the climb was almost certainly in the wrong place. It took the peloton a full 4:42 to ride from the 20km banner to the 18.6km banner (speed of 18km/h), and that was before the climb. Once on the climb, the first 3.6km took six minutes, a speed of 36km/h. In otherwords, if you believe the banners, then you believe that the speed doubled once the climb began. I don't, and so my conclusion is that the banner for the start of the climb was late by about a kilometer (this is further seen in the on-screen TV distances, which aren't always accurate, but they said 17.6km to go - I believe this).
So anyway, the point is that what you calculate varies quite a bit as a result of this.
Ron has estimated that the power of Schleck and Contador over the final 8km was 6.0 W/kg. I think this is close, but likely a small overestimate, because of drafting effects.
My overall estimation is that they took 49:08 to climb what I believe to be the final 17.6km at a gradient of 7.6%. This gives a VAM of 1,633 m/hour, and a relative power output of 5.9 W/kg.
These are of course estimates, not measurements, and if we want answers, then we need measurement. And for that, we look to Sorensen and Horner...
SRM data from the climb
The graph below shows Chris Anke Sorensen's power from the start of the final climb. If you recall, Sorensen set the climb up with an incredibly hard pull over the first 15 or so minutes.
So a massive pull - 415 W or 6.6W/kg, for 11:12, before Sorensen's day was up, and he dropped down to closer to 310W for the rest of the climb (also, note that the speed ranged between 20 and 25km/h, not 36km/h, which further suggests that the climb was marked incorrectly for TV purposes).
Once done, Sorensen settled down to complete the climb in just outside an hour, for an overall average power output of 330 W (5.2W/kg)
Chris Horner - a barometer for the yellow jersey
Even more interesting is Chris Horner, who had a tremendous day, climbing with the very best in the world. He was part of the chase group, dropped by Schleck and Contador, but who provide for a really useful barometer, because:
The eventual time gaps were relatively small - 1:45 in 50 minutes - which means that while we can't know the power output of the leaders, but it's not too much of a stretch to infer, and
The gap between Horner and the leaders remained relatively constant over the final 5 km of the climb. When Schleck attacked, the time gap grew relatively quickly to one minute, but then it edged up to 1:30, before actually staying in the range of 1:35 from 4km to go until the finish line. Therefore, it's useful because Horner's power output in the final 5km will be very similar to what was produced at the front of the race.
SRM have divided the climb in half, with the separation conveniently co-inciding with Andy Schleck's attack. Here's a breakdown:
Average power output for the first half of the climb - 377 W, at 5.9W/kg
Note the first portion of the climb, which co-incides with Sorensen's pull on the front, which we saw previously produced 6.6W/kg. You'll see that Horner rode in the range of 390 to 400W over this period, or ± 6.3W/kg. Horner's mass is 64kg, compared to Sorensen at 63kg, so the values are comparable. The reason it's lower is the slight benefit of shelter in the group, whereas Sorensen was at the front of the race
After the attack came, Horner completed the climb at 348 W (5.4W/kg).
Note once again, that Horner's power output over the final 4km will be very similar to that of Contador and Schleck, because of the constant time-gap between them. There is some error thanks to drafting, wind and so forth, but we're talking small differences. From the graph, Horner rode the final 4km at about 350W, and so Contador and Schleck finished the climb in this range of between 350W and 360W - 5.5W/kg to 5.7W/kg
Horner's overall average power output on the climb was 360 W, or 5.6W/kg. Interestingly, if you use the VAM method for Horner, you calculate a power output of 5.7 W/kg. Therefore, I am quite confident in saying that Contador and Schleck probably averaged 5.9W/kg over the entire climb.
So, a fascinating graph and insight into the Tour's big day. But what does it all mean?
The physiological implications of the climb
Before the Tour began, there was a great deal of debate about what the performances tell about physiology. I suggested that the power outputs of the 90s and 2000s, where these climbs were frequently done at 6.2, 6.3 and even 6.7W/kg, were a sign of doping. You may recall the notion, developed by Dr Ferrari and communicated by Armstrong in his book, that they aimed for 6.7W/kg as a threshold climbing output.
Nobody has managed to achieve even 6.2W/kg for any length of time in this Tour de France, let alone 6.7W/kg. Unless I am missing something. 6.6W/kg for 11 minutes, yes, but that rider then dropped to 5W/kg for the rest. In days gone by, that was the tempo the whole way (Incidentally, you can play around with this and work out how far ahead a guy would be if he did ride at 6.7W/kg - I estimate close to 3:00 on the climb. Contador and Schleck, dropped by 3 minutes....?)
And the top two climbers yesterday arguably rode at around 6.0 to 6.2W/kg for the first half of the climb, but their power output dropped off in the second half (which we know, because the time gaps ceased to grow over someone who was producing 5.5W/kg).
What is the physiology of riding at 6W/kg? If a cyclist has an efficiency of 24%, then the VO2 at 6W/kg is about 71 ml/kg/min. If this represents 85% of a maximum, then a VO2max of 83 ml/kg/min is estimated. If the efficiency is 23% (measured by Coyle for Armstrong in 1999), incidentally, then the VO2 is 74ml/kg/min and the estimated max would be 87 ml/kg/min. Neither jumps out as not-seen-before-physiology. But, if you go up to 6.2W or 6.3W/kg, then it starts to become, well, questionable.
Horner, incidentally, riding at 5.6 W/kg, would have an estimated VO2 of 66 ml/kg/min.
Conclusion
All told, then, I interpret the figures to be a good indication of the state of the sport. Whether you want to:
Base this on the physiology (which is only part of it, but I believe an important part), or
Compare the climbing times (most of which are 5 to 10% slower than before), or
Compare the estimates of power output this year to previous years (again, they're consistently 5 to 10% down), you arrive at the same point - it's a slower Tour.
Now, tactics are of course important. Many of you have argued this, and of course you're correct. Race situation dictates who attacks, when they attack and how they ride. That's why you need many climbs, and not a single one, to reach a correct conclusion.
One Tour provides many climbs, and I think there's still huge value in this year's numbers. However, because it's still a small number, this is a hypothesis, not a finding - what would be fantastic would be to track these stats over the next ten years, and compare the 90s to the 2000s to the 2010s. And also, to look at averages for top 10, top 50, top 100, to get an idea of depth.
Yesterday, on the Tourmalet, there were tactics - ride as hard as possible. 6.6W/kg from the bottom, followed by an attack, and I don't see any signs of 'hedging' of physiology on the day. It was as hard as was possible at that stage in the Tour, and I would continue, then, to hypothesize that the more stringent doping controls, the biopassport and the scrutiny on the sport have helped bring it down.
Call it "physiologically believable" (which many don't like, but I use it with its obvious intention), or call it signs of change, I do believe that the Tour is slower, and that the days of 6.3W/kg for 40 minutes are now the stuff of highlights and commemorative DVDs.
2011 Giro
Contador's Power Numbers on Mt. Etna
I have somewhere around 364 Watts. Or 5.96 Watts/Kg
Of course several assumptions were made. The biggest being the head wind. Even if I put a 15 kph head wind those were the numbers that I got.
Other assumptions being:
Distance: 20 m
Altitude length: 1892 m - 685 m
Weight: 61 Kg + 1 kg +Bike Weight
Mechanical efficiency: 3%
Attacked at 33:54 from the 20 km mark
Finish on 50:20 aprox (33% on his own)
Power numbers calculated on a constant average gradient.
Density: on average: 1.0365 kg/m3
Time drafting: 67%
Gravity factor: 74% of total power.
...a pensare male...si può vedere un certo trend nella prestazione del singolo atleta in 3 anni...
mentre quello di Indurain superiore
Scientific approach to the 1-h cycling world record: a case study
Sabino Padilla1,2,3, Iñigo Mujika1,2,3, Francisco Angulo1, and Juan Jose Goiriena3
+ Author Affiliations
1 Departamento de Investigación y Desarrollo, Servicios Médicos, Athletic Club de Bilbao;
2 Mediplan Sport, Vitoria-Gasteiz; and
3 Instituto Médico Basurto, Universidad del Paı́s Vasco (UPV-EHU), Leioa, Basque Country, Spain
Submitted 29 November 1999. Accepted in final form 1 May 2000.
Next Section
Abstract
The purpose of this study was to describe the physiological and aerodynamic characteristics and the preparation for a successful attempt to break the 1-h cycling world record. An elite professional road cyclist (30 yr, 188 cm, 81 kg) performed an incremental laboratory test to assess maximal power output (W˙max) and power output (W˙OBLA), estimated speed (V OBLA), and heart rate (HROBLA) at the onset of blood lactate accumulation (OBLA). He also completed an incremental velodrome (cycling track) test (VT1), during whichV OBLAVT1 and HROBLAVT1 were measured and W˙OBLAVT1 was estimated. W˙maxwas 572 W, W˙OBLA 505 W, V OBLA52.88 km/h, and HROBLA 183 beats/min.V OBLAVT1, HROBLAVT1, andW˙OBLAVT1 were 52.7 km/h, 180 beats/min, and 500.6 W, respectively. Drag coefficient and shape coefficient, measured in a wind tunnel, were 0.244 and 0.65 m2, respectively. The cyclist set a world record of 53,040 m, with an estimated average power output of 509.5 W [continua] .
Ultima modifica:
su 60'
lo ribadì, se non ricordo male, in una conferenza in Australia (pre mondiale di 2 anni fa)
cerco video
Penco che il valore di FTP di Contador sia inferiore, sempre considerando che sono valori calcolati indirettamente e non da misurazione strumentale diretta:
2009
2010
mentre quello di Indurain superiore
Grazie
qualcuno sa calcolarmi il tempo stimato su una salita di 17 km al 5% medio procedendo a 265 w medi? (peso 64 kg)


Immagino ti riferisca alla salita di Montevergine.
Io sono della zona e la faccio un paio di volte all'anno.
Con un peso di 65 kg e FTP 266 w pero "scremata" in quanto per arrivare sotto Montevergine devo prima salire Monteforte Irpino che è dura e di solito con il mio gruppo la affrontiamo a tutta , ci impiego 54' a 250 w medi quindi il calcolo fatto prima e abbastanza coerente con la realtà.
Buona cronoscalata, io ti verro a vedere.
Ps a che ora inizia?
Io sono della zona e la faccio un paio di volte all'anno.
Con un peso di 65 kg e FTP 266 w pero "scremata" in quanto per arrivare sotto Montevergine devo prima salire Monteforte Irpino che è dura e di solito con il mio gruppo la affrontiamo a tutta
, ci impiego 54' a 250 w medi quindi il calcolo fatto prima e abbastanza coerente con la realtà.Buona cronoscalata, io ti verro a vedere.
Ps a che ora inizia?
buongiorno, su consiglio di alcuni utenti del forum sono "emigrato" (dal 3D "relazione Watt/Fc" di Max62) in questo 3D perche', e convengo con loro, questo rappresenta sicuramente il dibattito piu' tecnico relativo all'allenamento con i misuratore di potenza.
non allungando ulteriormente chiedo:
la vostra opinione circa la "proporzionalita'" tra i valori di watt e Fc rilevati durante un test di tipo incrementale al quale mi sono sottoposto presso un centro specializzato.
chiedo consiglio perche' mi sembra che i valori siano troppo elevati in Fc rispetto alla potenza che riesco a sviluppare. ne deriva un allenamento durissimo da realizzare che dopo qualche mese mi ha "bruciato".
i miei "dati" sono:
-allenato (3 sedute settimanali piu' domenica per circa 10 ore settimanali);
-eta' 44 anni;
-peso 67 kg;
-fc a riposo 63 bpm;
-fc Max 187
i dati rilevati sono:
ritmo bpm watt
Lungo 118/143 130/175
Medio 144/162 176/210
SA 163/181 211/245
da quanto posso capire mi viene attribuita una SA di 172 bpm (interpolando i valori 163/181) ma a me sembra piu' probabile un 165 bpm.
potreste fare qualche considerazione?
di seguito ho inserito alcune note nonche' le modalita' che ho seguito per effettuare un test outdoor sui 20':
".... ho un PowerTap per BDC e mi alleno in modalita' promiscua perche' sono un biker ed alcuni allenamenti prevedono l'utilizzo della MTB.
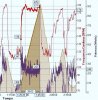
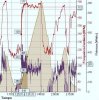
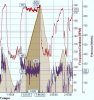
ho inserito delle immagini tratte da SportTracks relative ad un test di 20' realizzato nel seguente modo:
-riscaldamento di circa 1h 15' con alcuni tratti "rompifiato" e altri di recupero;
-a tutta, nel senso che non ho cercato di gestire in crescendo la prova ma sono partito al massimo delle mie possibilita' ed ho sempre cercato di dare il massimo durante il test;
-lunghezza tratto test: 5300 mt;
-dislivello: 320 mt;
-pendenza media: 6%.
ho inserito 3 grafici perche':
-il 20 di 20 e' quello relativo a tutto il test;
-il 6 di 20 evidenzia il periodo iniziale del test (6') in cui ho dato una buona potenza;
-il 14 di 20 e' la parte restante del test."
da questi dati riuscireste ad indicarmi i watt e la fc in soglia?
scusate la lungaggine e spero di non aver fatto troppa confusione.
intanto vi ringrazio ed attendo le vostre considerazioni
non allungando ulteriormente chiedo:
la vostra opinione circa la "proporzionalita'" tra i valori di watt e Fc rilevati durante un test di tipo incrementale al quale mi sono sottoposto presso un centro specializzato.
chiedo consiglio perche' mi sembra che i valori siano troppo elevati in Fc rispetto alla potenza che riesco a sviluppare. ne deriva un allenamento durissimo da realizzare che dopo qualche mese mi ha "bruciato".
i miei "dati" sono:
-allenato (3 sedute settimanali piu' domenica per circa 10 ore settimanali);
-eta' 44 anni;
-peso 67 kg;
-fc a riposo 63 bpm;
-fc Max 187
i dati rilevati sono:
ritmo bpm watt
Lungo 118/143 130/175
Medio 144/162 176/210
SA 163/181 211/245
da quanto posso capire mi viene attribuita una SA di 172 bpm (interpolando i valori 163/181) ma a me sembra piu' probabile un 165 bpm.
potreste fare qualche considerazione?
di seguito ho inserito alcune note nonche' le modalita' che ho seguito per effettuare un test outdoor sui 20':
".... ho un PowerTap per BDC e mi alleno in modalita' promiscua perche' sono un biker ed alcuni allenamenti prevedono l'utilizzo della MTB.
ho inserito delle immagini tratte da SportTracks relative ad un test di 20' realizzato nel seguente modo:
-riscaldamento di circa 1h 15' con alcuni tratti "rompifiato" e altri di recupero;
-a tutta, nel senso che non ho cercato di gestire in crescendo la prova ma sono partito al massimo delle mie possibilita' ed ho sempre cercato di dare il massimo durante il test;
-lunghezza tratto test: 5300 mt;
-dislivello: 320 mt;
-pendenza media: 6%.
ho inserito 3 grafici perche':
-il 20 di 20 e' quello relativo a tutto il test;
-il 6 di 20 evidenzia il periodo iniziale del test (6') in cui ho dato una buona potenza;
-il 14 di 20 e' la parte restante del test."
da questi dati riuscireste ad indicarmi i watt e la fc in soglia?
scusate la lungaggine e spero di non aver fatto troppa confusione.
intanto vi ringrazio ed attendo le vostre considerazioni
Allegati
D
Deleted member 2182
Guest
Sporttracks ha il plugin che calcola la tua ftp e ti fornisce le varie CP dell'uscita considerata.
sono andato sul sito del produttore ed ho scaricato il plugin GPS2PowerTrack (non so se e' quello che puo' fare il calcolo della FTP) ed ho provato a configurarlo ma non e', per me, di immediato utilizzo. avete qualche dritta da suggerirmi?Sporttracks ha il plugin che calcola la tua ftp e ti fornisce le varie CP dell'uscita considerata.
- Stato
- Chiusa ad ulteriori risposte.
-

CANNONDALE SUPERSIX EVO CARBON DISC FORCE eTAP AXS (2020) – TAGLIA 48
TELAIO :Cannondale SuperSix EVO (BallisTec Carbon), passaggio cavi integrato,freni a disco flat mount, perni passanti 12x100 / 12x142 FORCELLA :Ballis Tec Carbon, SAVE, corona integrata, perno passante 12x100mm GRUPPO :SRAM Force eTap AXS 12v (completamente elettronico Wireless) GUARNITURA...